Mining the Web Collective
In March 2012, Dr Bruno Latour and his team from the Sciences Po Media Lab organized a workshop that assembled a selected group of researchers from India to explore methods of Controversy Mapping. It was hosted by Dr J. Srinivasan, Director of the Divecha Centre for Climate Change at the Indian Institute of Science, Bangalore, India.
While the context of this workshop focussed on deciphering and mapping opinions related to academic controversies surrounding climate change, the very same techniques of deploying digital tools to crawl through associated content on the websphere, maybe used to map any other controversy that has been actively influencing public and political opinion.
As one of the participants in the workshop, in an attempt to make my interpretation as accessible as possible to a wider inter-disciplinary audience, below is my own assimilation and extrapolation of the musings and discussions that entailed. Further I have drawn out limitations and future directions towards more viable paradigms that augment the mapping and democratization of public opinion.
The session drew an outset around how new digital tools could aid researchers by enabling them to quickly see an individual entity’s data as well as it’s associated aggregates, and register all of this within a single view in real-time. Contrasting the traditional methods of data collection through individual surveys, new digital methods can almost instantaneously bridge the gap between the individual and the collective and help us answer the question that Latour poses in his most recent paper that revisits social theory around the Tardean concept of reciprocally connected ‘monads’ -- ''.... is there an alternative to the common sense version that distinguishes atoms, interactions and wholes as successive sequences (whatever the order and the timing)? An alternative that should not oblige the inquirer to change gears from the micro to the macro levels ..... but remains fully continuous ...'' [Latour et al , 2012].
Encompassing the Collective
The geometric basis of the universe as expressed by Edgar Allan Poe, asserts that the ‘universe.. is a sphere of which the centre is everywhere and circumference nowhere’ (Eureka, p 20) This is essentially a post-Euclidean conception of space, in line with the view of early 20th century physicist Alexander Friedmann who posits that the ‘universe is not finite in space, but neither does space have any boundary’ and so the centre of the universe is relative to every single atom — hence every single observer.
In many ways, the process of data collection and visualization that was carried out at the workshop tried at best to mimic this geometric basis of space. By starting with a single entity (say, mammals) the empiricist begins with nothing more than a named 'label'. One then extends the specification of this entity, by populating a list with an increasing number of elements. This process of 'learning' about an entity is essentially an infinite process, as many abstract associations maybe permitted to enter the list. However, the observer stops this iterative process at a point when he feels that he has enough knowledge to describe the entity within the (seemingly finite) 'scope' of study. What we then have is a highly individualized point of view with respect to one entity that has a view of all it's associated attributes.
It is worth noting here that the attributes themselves can be looked at as individualized entities, and vice versa, from their own view point, depending on the way in which one navigates, thereby making the map invertible. For instance while 'egg-laying' maybe one of the attributes of a 'mammal', if we navigated to define 'egg-laying' to be our starting entity, it's view point can contain attributes like 'mammals' and 'birds'. This process is entirely different from the bottom up approach of constructing a general view by combining individual counterparts. In fact, there is no one general view here, as the picture is an exploded graph emanating from a single entity's view point, each to it's own 'umwelt'.[Kaveli et al, 2010].
(Re)formation of Opinion
The formation of a fundamental percept in the human brain, for instance, during the cognitive activity of reading a text, is in itself a bottom-up serial process where individual words progressively make up semantic associations to form a meaningful structure (just as this sentence), along with contextual association with previously acquired knowledge. This capacity limit for information processing [Rene and Ivanoff, 2005] which is a prerequisite for our highly focussed mechanism of attention is the reason why we cannot capture the entire star map within a single glance at the night sky.
Somewhere down this iterative line of observing an entity, and not having access to all of its attributes in entirety, leads to over-specification and an entanglement with isolated systems, thereby falling into a local maxima as opposed to a global solution. This is the basis of opinion formation and by envisaging it as a 'closed' object it is transformed into a percept, open to interpretation and often conflicting with another, thereby resulting in a controversy.
One of the objectives of the controversy mapping workshop was to transform the 'immutable' percept surrounding a controversy into a visual map that all at once registers weblinked attributes surrounding it, to give us a possibly emergent and unbiased picture.
The Method to the Madness
The process of framing of a ‘controversial topic’ and the collation of massive data and links on the internet that surround the topic could indeed be a cumbersome task. An informed approach is thus required in order to achieve a meaningful result.
Firstly, one needs to consider reliable sources and means of knowledge production that provide enough fuel to kindle the analysis of the controversy. One needs to move on from casual matters of opinion or statements (such as “the cumulative effects of CFC result in ozone layer depletion”) to identifying a hypothesis or theory that is being actively contested by academicians and experts through research and publication. This serves to outline an important preliminary sketch of the controversy that exists within the community.
Secondly, it is essential to remember that specialized researchers do not exist in self-centered isolation but often operate in tandem with multiple stakeholders, investors, donors, sponsors and a diverse audience that they cater to through articles, books, research projects and published journals. For instance, several theorists who are into the business of developing a so-called ‘language of critique’ often ensure through working group meetings that a selected group of researchers are on the ‘same page’ while using common words to canvass a spearhead towards prospective calls from popular journals. At other times, one may perceive a very direct link between mainstream press and cutting-edge research. This group comprising allies and endorsers are an important constituent of the mapping process as they provide key points of entry into the controversy.
Further, as more and more data relating to a controversy is accrued, one must decipher not only how the position of the controversy is being dynamically shaped over time along with its stakeholders but also be able to extrapolate how and why its current position of uncertainty might evolve. This would involve identifying potential points of contention that could respark a debate over an issue that has reached near closure.
Mapping the Controversy around ‘Anthropocene’
 |
|---|
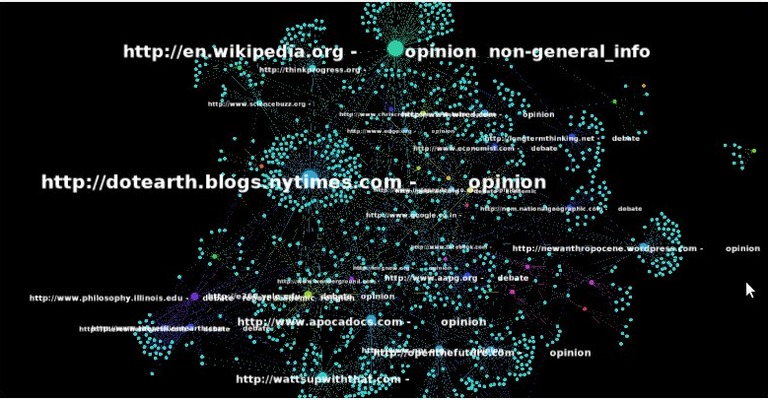
The topic chosen by my group (which consisted of scholars Neesha Dutt, Muthatha Ramanathan and Prasanna Kolte) was ‘Anthropocene’, a geo-chronological term that was informally introduced by a Nobel laureate in the field of atmospheric chemistry, Paul Crutzen, at a dinner party. ‘Anthropocene’ apparently marks the post industrial period as a time window that represents the impact that human activities have had on earth’s ecological systems, thereby affecting climate change. The widespread acceptance and popularity of the the word has even seen a move to officially recognize ‘Anthropocene’ as geological unit of time, complemented by a number of dubious research projects that assume the ‘anthropocenic’ view of climate change. The tools used were Navicrawler to populate a massive list of webpages that featured the keyword and other landing websites that each of the webpages point to. The context of the websites based on their content were labelled manually and no native text parsing and analysis was used. An interconnected visual graph structure was then obtained using Gephi, a software that uses Force Layout -2 , a graph layout algorithm for network visualization. [M. Bastian et al, 2009].
Future Directions
Including a layer of geographical representation to the formation and spread of an opinion is a key direction towards which opinion mining and controversy mapping is headed. A limiting factor while crawling articles over the web using currently available digital tools is the inaccurate representation of geographical source. An article posted in a popular science blog in India, may actually have its server hosted in California and this fact may often be abstracted to our crawler.
Furthermore, apart from the geographical source of a web article, an interesting direction would be to employ geo-located public opinion interfaces to collect a sample set of public opinion related to an issue, across diverse geographical locations in realtime. This would serve as valuable layer to overlay onto the controversy web map.
Another constraint of the digital methods referred to here within, is the medium specific approach that does not look beyond the sample space of the internet. Listening to and analyzing internet social media dynamics and combing large data sets to churn out a report is not much of a challenge. Cross media influences in public and political opinion have become increasingly clear with television broadcasts and newspaper reports directly contributing to discussions that happen on internet forums and websites. Take for instance Blue Fin Labs that started off within the Cognitive Machines group of MIT Media Lab. Initially known as the Human Speechome project which used deep machine learning algorithms to map out relationships between spoken word and context, Blue Fin Labs now applies the same technique to map internet comments and posts to corresponding audio-visual stimuli in television broadcasts that caused those comments to be made on the web.
Video
Data visualization of connecting the social graph to the TV content graph
References
- Cappi, Alberto (1994). "Edgar Allan Poe's Physical Cosmology". The Quarterly Journal of the Royal Astronomical Society 35: 177–192
- Castells, M. (2000). Materials for an exploratory theory of the network society. British Journal of Sociology Vol. No. 51 Issue No. 1 (January/March 2000).
- Edgar Allen Poe (1848) ‘Eureka : A Prose Poem'.
- Kull, Kaveli 2010. Umwelt. In: Cobley, Paul (ed.), The Routledge Companion to Semiotics. London: Routledge, 348–349.
- Latour, B. et al 2012 “The Whole is Always Smaller Than It’s Parts A Digital Test of Gabriel Tarde’s Monads” British Journal of Sociology (forthcoming)http://www.bruno-latour.fr/sites/default/files/123-WHOLE-PART-FINAL.pdf
- M. Bastian, S. Heymann, and M. Jacomy, “Gephi: an open source software for exploring and manipulating networks,” in International AAAI Conference on Weblogs and Social Media. Association for the Advancement of Artificial Intelligence, 2009.
- M. E. J. Newman, “Analysis of weighted networks,” 2004, arxiv:cond-mat/0407503.
- Reynolds, C. W. (1987) Flocks, Herds, and Schools: A Distributed Behavioral Model, in Computer Graphics, 21(4) (SIGGRAPH '87 Conference Proceedings) pp. 25-34.
- Rene Marois and Jason Ivanoff, Capacity limits of information processing in the brain, TRENDS in Cognitive Sciences Vol.9 No.6 June 2005
- T. M. J. Fruchterman and E. M. Reingold, “Graph drawing by force-directed placement,” Softw: Pract. Exper., vol. 21 no. 11, pp. 1129–1164, Nov. 1991.
Author

